 Josh Moller-Mara
I remember back when taking a Bayesian statistics course we were able to guess the number of subpopulations of fish based on a histogram of fish length measurements. Well, a few months later I totally forgot how we did this so I set out to relearn it. This problem in general is called “clustering”, where one finds “clusters” in the data. I’ve talked about clustering a bit before on my post on using k-means clustering to generate color themes from pictures. Here I’ll talk about clustering using mixture modeling and the EM algorithm and how we can use this model to get an idea of how many clusters are in our data set.
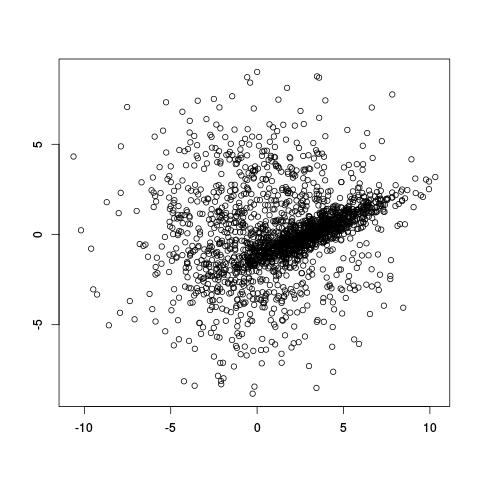
Take the (artificial) example below. It looks like there are populations of points: one broad circular one, and a denser diagonal one in the middle. How do we decide which of the two clusters points belong to, and even before that, how do we even decide that there are only two clusters?
If we already knew there were two clusters, why not try using the k-means clustering algorithm? A potential problem with k-means is that it divides spaces up into a Voronoi diagram, meaning that the boundaries are lines. Worse yet, with only two clusters, k-means tries to separate these two clusters using one line!
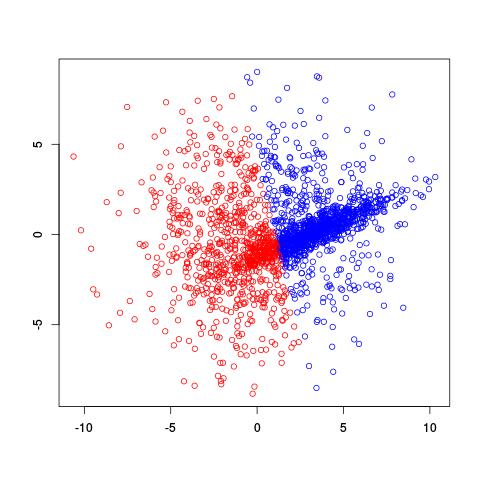
Not a very good separation of these clusters, is it?
Let’s try using a different model. Let’s assume that the points are generated from one of several multivariate Gaussian distributions (which they actually are in this case, which is kind of cheating, haha). This is called a multivariate Gaussian mixture model. So we can think of the probability of a point $x$ being generated is
\[p(x) = \sum_{i=1}^k \alpha_i \cdot \text{N}(x|\mu_i, \sigma^2_i)\]
where $\alpha_i$ is the probability of being in cluster $i$ and $\mu_i$ and $\sigma^2_i$ tell us about the location and spread of the $i$th cluster. So we’re interested in estimating the values of $\mu_i$, $\sigma^2_i$, and $\alpha_i$ given a bunch of data. However, there’s no closed-form solution to estimate all these values at once, the way we might if there were only one Gaussian cluster. Instead, we use the EM algorithm to iteratively estimate values of the parameters of interest. Here’s what the EM algorithm returned for two clusters on the same data set:
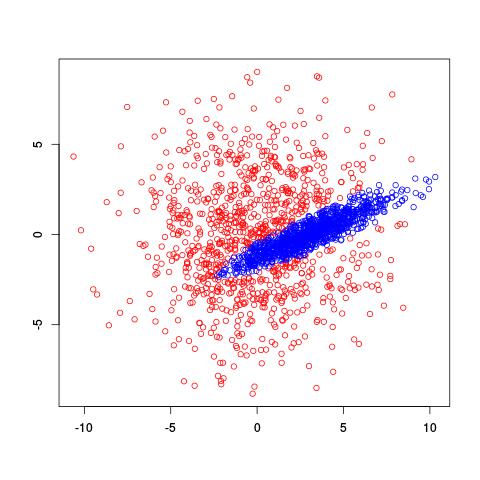
Very cool! It recognized the diagonal shape of the inside cluster and has a nice, rounded border. So how does this estimation actually work? You can actually find R code for the EM algorithm on Wikipedia.
Basically, there are two steps in EM. “E” stands for “expectation”, where we estimate values for hidden or latent variables. Only by estimating values for these latent variables are we able to perform step “M” where we “maximize” likelihood using maximum likelihood estimation (MLE). In this problem our hidden variables are the memberships of each point. We don’t observe which cluster a point came from, but if we did have a label of each cluster, it would be really easy to use MLE on each cluster to get a value for $\mu_i$ and $\sigma_i$. Instead of guessing labels though, we’ll try to estimate for each point the probability it came from each cluster. So if we had a function $h(m,n)^{(t)}$ that told us the probability of the $m$th point coming from the $n$th cluster (at iteration/time step $t$), estimating $\alpha_n$, $\mu_n$ and $\sigma^2_n$ is as simple as:
$$S_n^{(t+1)} = \sum_{m=1}^M h(m,n)^{(t)}$$ $$\alpha_n^{(t+1)} = S_n^{(t+1)}/M$$ $$\mu_n = 1/(S_n^{(t+1)}) \sum_{m=1}^{M} h(m,n)^{(t)} X_m$$ $$\sigma_n = 1/(S_n^{(t+1)}) \sum_{m=1}^{M} h(m,n)^{(t)} (X - \mu_n) (X - \mu_n)^T$$
(If I remember correctly, this is basically taken straight from The Elements of Statistical Learning.)
That was the maximization step. Now, given these new estimates for parameters, we can use
$$h(m,n)^{(t)} = \alpha_n \cdot N(X_m, \mu_n, \sigma_n)/\sum_i^N { \alpha^j \cdot N(X_m, \mu_i, \sigma_i) }$$
to get better estimates for the probabilities $h(m,n)$! This is the expectation step. So we iterate expectation, maximization, expectation, etc. over and over again to get better estimates of our parameters of interest. It can be shown that doing these steps can only improve the likelihood of the fit, although it is possible to be stuck in a local optimum (EM is very sensitive to initial conditions).
Here’s an illustration of the EM algorithm being run on our data set with two clusters:
But we skipped a step. How do we actually know there are two clusters here? Maybe we don’t. One thing about using a mixture model though is that we have a likelihood function. By plugging in the data and our estimated parameters, we can see how good of fit our model is. From there, we could actually just iterate from say, 1 to 10 clusters, running EM for each number of clusters and select the one that has the best fit.
Actually, we’ll have to be a bit careful because when we fit more clusters we give the model more flexibility to fit better. So we also want to punish models that are too complex. So instead of using the plain likelihood, we’ll use the Akaike Information Criterion (AIC) which takes the number of parameters in a model as well as the likelihood of the model to give us a relative measure of model quality.
Here’s an example of running EM with between 1 to 6 clusters:

And here’s the output of the AIC for each number of clusters. Lower values of AIC are better.
| Clusters | AIC |
| 1 | 9667.175 |
| 2 | 8916.349 |
| 3 | 8936.690 |
| 4 | 8927.173 |
| 5 | 8940.873 |
| 6 | 8939.132 |
We see here that 2 clusters has the lowest AIC! There were, in fact, only two clusters used to generate this. Very cool!
There are other ways to estimate mixture models outside of EM. In the Bayesian statistics class I took, we used Markov Chain Monte Carlo methods using R and JAGS to fit mixture models. There’s a package called bayesmix that helps do this for you.
Finally, here’s the code to do this clustering: