Articles tagged with R:

  • Experiments with Latent Dirichlet Allocation

    In a couple of my previous posts I talked about using clustering colors with k-means and counting clusters with EM. This kind of clustering is fairly straightforward, as you have some notion of distance between points to judge similarity. But what if you wanted to cluster text? How do you judge similarity there? (There are certain measures you could use, like the F-measure, which I'll talk about in a later post.)

    One way is to use Latent Dirichlet Allocation, which I first heard about while talking to a Statistics 133 GSI, and then later learned about while reading probabilistic models of cognition. Latent Dirichlet Allocation is a generative model that describes how text documents could be generated probabilistically from a mixture of topics, where each topic has a distribution over words. For each word in a document, a topic is sampled, from which a word is then sampled. This model gives us probabilities of documents, given topic distribution and words. But what's more interesting here is learning about topics given the observed documents.

    Here's the plate notation view of LDA, which describes exactly how documents are generated:

    A plate notation explanation of LDA.

    The image above was created using TiKZ-bayesnet (TiKZ is super-fun by the way) for LaTeX, which actually provides an LDA example. I've taken their example here and modified the variable names and layout slightly to match my code.

    Each box is a "plate" which signifies that the structure should be repeated according to the sequence in the plate's lower right corner. Think of it like a "for-loop" for graphs.

    Now I'll go over all these variables.
    • $alpha_{topics}$ and $alpha_{words}$ are hyperparameters that you set by hand. They show how the Dirichlet distributions create distributions over topics and words, respectively. A Dirichlet distribution outputs a vector that sums to 1, which can be used as the probabilities for a multinomial distribution. We'll usually set $alpha_{topics}$ and $alpha_{words}$ to be a number greater than 0, but much less than 1. The idea here is that we generate mixtures that are very different from each other. Take a look at the picture below, which represents some sampling from a Dirichlet distribution over 3 categories for different values of the $alpha$ parameter. (Actually $alpha$ is itself a vector of 3 numbers, so $alpha$ of 1 really means $alpha$ is [1, 1, 1])

      How the alpha parameter affects Dirichlet distribution.

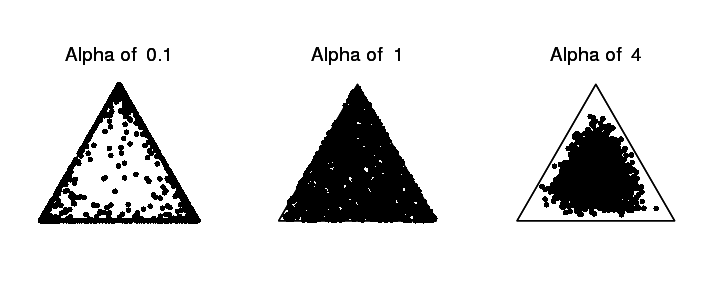
      The leftmost distribution creates highly varied samples. Think of the three points as the proportion of three different words, like "dog", "cat", and "mouse", and we're generating topics. This might create topics like [8, 0.1, 0.1] (mostly dog), [0.2, 0.9, 0] (mostly cat), etc. Whereas the rightmost distribution creates topics that are much more in the center, which means they're much closer to each other. Here we might create topics like [0.3, 0.4, 0.3], which means the word "dog", "cat", and "mouse" are almost equally likely to be generated by this topic. Smaller alpha values ...


  • Counting clusters with mixture models and EM

    I remember back when taking a Bayesian statistics course we were able to guess the number of subpopulations of fish based on a histogram of fish length measurements. Well, a few months later I totally forgot how we did this so I set out to relearn it. This problem in general is called "clustering", where one finds "clusters" in the data. I've talked about clustering a bit before on my post on using k-means clustering to generate color themes from pictures. Here I'll talk about clustering using mixture modeling and the EM algorithm and how we can use this model to get an idea of how many clusters are in our data set.

    Take the (artificial) example below. It looks like there are populations of points: one broad circular one, and a denser diagonal one in the middle. How do we decide which of the two clusters points belong to, and even before that, how do we even decide that there are only two clusters?

    A set of points. There is a broad spattering of points in a disk. Inside the disk is a denser, slightly diagonal elliptical region of points.

    If we already knew there were two clusters, why not try using the k-means clustering algorithm? A potential problem with k-means is that it divides spaces up into a Voronoi diagram, meaning that the boundaries are lines. Worse yet, with only two clusters, k-means tries to separate these two clusters using one line!

    k-means does not cluster this set very well.

    Not a very good separation of these clusters, is it?

    Let's try using a different model. Let's assume that the points are generated from one of several multivariate Gaussian distributions (which they actually are in this case, which is kind of cheating, haha). This is called a multivariate Gaussian mixture model. So we can think of the probability of a point $x$ being generated is

    \[p(x) = \sum_{i=1}^k \alpha_i \cdot \text{N}(x|\mu_i, \sigma^2_i)\]

    where $\alpha_i$ is the probability of being in cluster $i$ and $\mu_i$ and $\sigma^2_i$ tell us about the location and spread of the $i$th cluster. So we're interested in estimating the values of $\mu_i$, $\sigma^2_i$, and $\alpha_i$ given a bunch of data. However, there's no closed-form solution to estimate all these values at once, the way we might if there were only one Gaussian cluster. Instead, we use the EM algorithm to iteratively estimate values of the parameters of interest. Here's what the EM algorithm returned for two clusters on the same data set:

    Illustration of clustering using mixture models and EM.

    Very cool! It recognized the diagonal shape of the inside cluster and has a nice, rounded border. So how does this estimation actually work? You can actually find R code for the EM algorithm on Wikipedia.

    Basically, there are two steps in EM. "E" stands for "expectation", where we estimate values for hidden or latent variables. Only by estimating values for these latent variables are we able to perform step "M" where we "maximize" likelihood using maximum likelihood estimation (MLE). In this problem our hidden variables are the memberships of each point. We don't observe which cluster a ...


  • Color theme generation from images using k-means

    Note, this post more or less follows this post by Charles Leifer, except in less detail, and explained more poorly.

    One of the top posts on the unixporn subreddit (SFW, really.) is this post that shows how a redditor generates color themes for his window manager from images using a script. He gets the code from Charles Leifer, who explains how the script works. Basically, the script detects the dominant colors in the image using k-means clustering.

    As an exercise, I tried recreating the script in R. I didn't exactly look at Charles' code, but I knew the basic premise was that it uses k-means to generate a color palette.

    I liked the idea of using R over Python because (a) as a statistics major I use R all the time and (b) there's no other reason, R's just fairly nice to work with.

    Color spaces

    k-means performs differently depending on how you represent colors. A common color space to use is RGB, which represents colors by their red, green, and blue components. I found that representing colors in this manner tended to result in points along the diagonal. This happens since images usually have many shades of the same color, so, if you have $(r, g, b)$ you also tend to have $(r+10, g+10, b+10)$. This results in clusters having a sort of elongated shape, which isn't that great for k-means since it seems better at picking out more "round" clusters. There is often a lot of correlation between dimensions. Maybe I'm not making a lot of sense here, suffice to say I wasn't terribly pleased with the clusters I was getting.

    A 3 dimensional representation of the colors used in an image. In RGB space.

    The next color space I tried was HSV, which represents colors in terms of hue, saturation, and value. This actually got me some fairly satisfactory clusters. As you can see in the graphic below, it's much easier to separate different colors. The only problem was that it made me want to put more weight on the "hue" dimension than the "saturation" or "value" dimensions. Many clusters ended up just being gray.

    A 3 dimensional representation of colors in the same image, but in HSV space.

    One cool thing is that R already does HSV fairly easily using the rgb2hsv function.

    I was most satisfied using LAB space. This represents colors with one "lightness" dimension and two color dimensions "A" and "B". It was made to approximate human vision, and as you can see from the graphic below, distances between colors seem more meaningful. In fact, using Lab space is a recommended way of finding color difference. A good package for using this in R is the colorspace package.

    Colors represented in LAB space.

    k-means

    Another nice thing about R is that it has its own kmeans function built in. I actually tried writing my own, which looks like this:

    ## Do k-Means
    ## It tends to lose some k values
    kMeans <- function(k, X, iter = 5) {
        ## Assign random membership
        membership <<- sample(1:k, size=nrow(X), replace=TRUE)
    
        for(i in 1:iter) {
            mus <<- tapply(1:nrow(X ...

Page 1 / 1

Category
Tagcloud
neuro LaTeX js bad-tagging-scheme pelican R testing vim-is-okay-too emacs statistics wm sysadmin productivity
Latest posts